Basic information about a job is available in the main Job Controller window. You can see additional job information by right-clicking a job or by adding additional columns to the Job Controller window.
Viewing Job Details
Additional details for a particular job can be viewed from the Job Controller window by right-clicking the job and then clicking Detail. You can view the following job details in the Job Details dialog box:
|
Job Details |
Description |
|
General |
Displays the general information about the selected job, such as the subclient, storage policy, etc. |
|
Progress |
Displays more specific statistical information about the current phase of the selected job. If a job does not complete successfully, an error code appears in the Reason for job delay box. See Viewing the Error Codes for a Job for additional information. |
|
Streams |
Displays the data transferred by stream on the MediaAgent the job is using. |
|
Attempts |
Provides information on each attempt of each phase of the selected job, such as the status of each phase of the job. Each phase has a corresponding client log that can aid in troubleshooting data protection problems. Note that the Data Size/Transferred field amount includes metadata, and therefore, will be larger than the actual size of the backed up data. |
|
Job Retention |
Provides the retention information for the data protection job's storage policy. The associated storage policy copies will be listed with their defined retention rules. From here, you can quickly identify whether the storage policy copies are defined with basic or extended retention rules, and the dates until which the data will be retained for each storage policy copy. |
|
Events |
Displays the events about the selected job from All Found Events window. For more information about events, see the Event Viewer. |
|
Additional Details |
Displays the additional details about the job such as Compression details, client status, etc. |
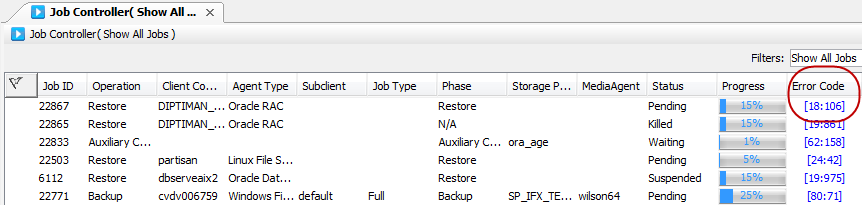
Viewing the Error Codes for a Job
If a job has not completed successfully, the Error Code column will display a unique code linking to available troubleshooting and knowledgebase article(s) relevant to that error from the customer support website. These articles may include special considerations for the type(s) of job(s) you are running, suggested workarounds for issues, and common causes for that particular error.
If an error code pertains to more than one issue, the customer support website will display links to all articles for which the code is relevant. Conversely, if an error code does not have any articles associated with it, the customer support website will display a message indicating that no articles exist for that code.
Note that jobs which fail Data Integrity Validation will be moved to pending status. Review the error code and description of the pending job from the Job Controller to identify the reason for failure. See Handling Data Integrity Validation Errors for troubleshooting Data Integrity Validation errors.
Use the following steps to view the error codes of a job which has not completed successfully:
From the CommCell Console ribbon, on the Home tab, click Job Controller.
-
In the Job Controller window, right-click any column heading and click Choose Columns | Error Code.
The Error Code column is displayed in the Job Controller window.
-
For a failed job, click on the error code in the Error Code column to launch the Customer Support website.
-
Enter your credentials for the Customer Support website.
-
Review the troubleshooting articles related to the error code.
The Customer Support website displays links to all relevant articles. If an error code does not have articles associated with it, the customer support website displays a message indicating that.
Viewing Log Files
You can view log files of an active job from the CommCell Console. You can also send the log files by page to an email recipient.
Use the following steps to view and send the log files of an active job in the Job Controller:
From the CommCell Console ribbon, on the Home tab, click Job Controller.
-
Right-click any job and click View Logs.
-
In the Log File for Job dialog box, click File and then click Send Page.
-
In the SMTP Parameters dialog box, entering the email recipient's SMTP Parameters.
-
Click OK.
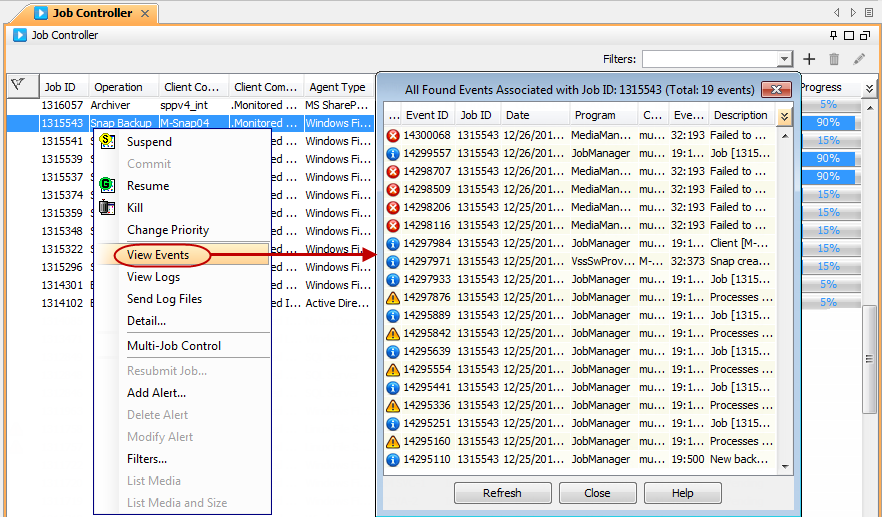
Viewing Events
You can view the events occurring within a CommCell from the Job Controller. By default, an event is automatically created in the Event Viewer for all the jobs and operations running in a CommCell.
Use the following steps to view the events of an active job in the Job Controller:
-
From the CommCell Console ribbon, click the Home tab and then click Job Controller.
-
Right-click any running job and click View Events.
All the events associated with the selected job will be displayed.