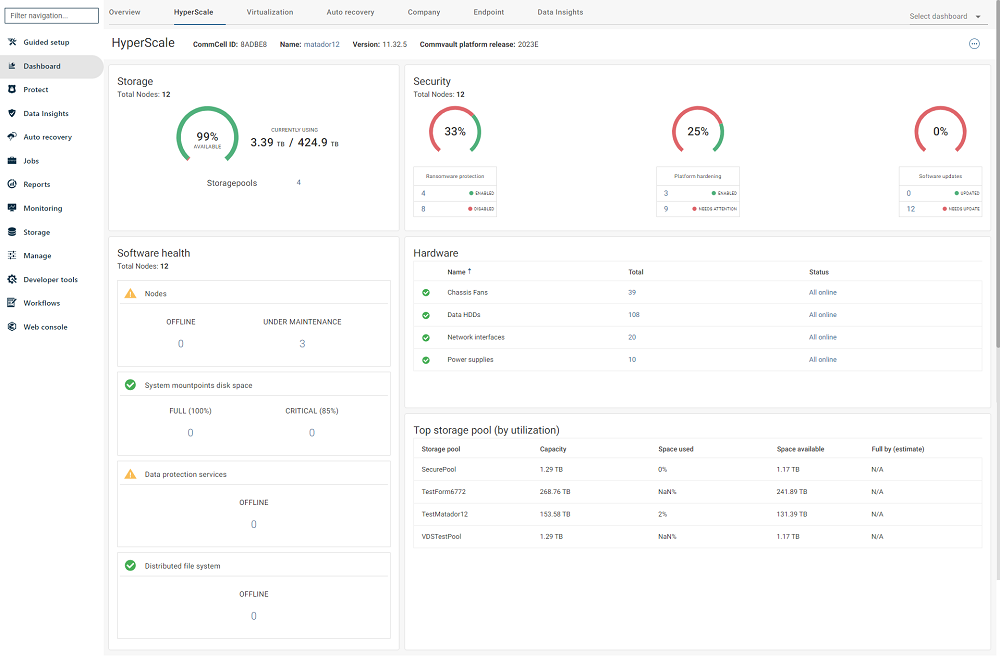
The HyperScale dashboard in the Command Center displays the current status of Commvault HyperScale X nodes, including hardware errors, and helps you quickly assess overall node health.
You can access the HyperScale dashboard from the tabs at the top of the Dashboard page in the Command Center.
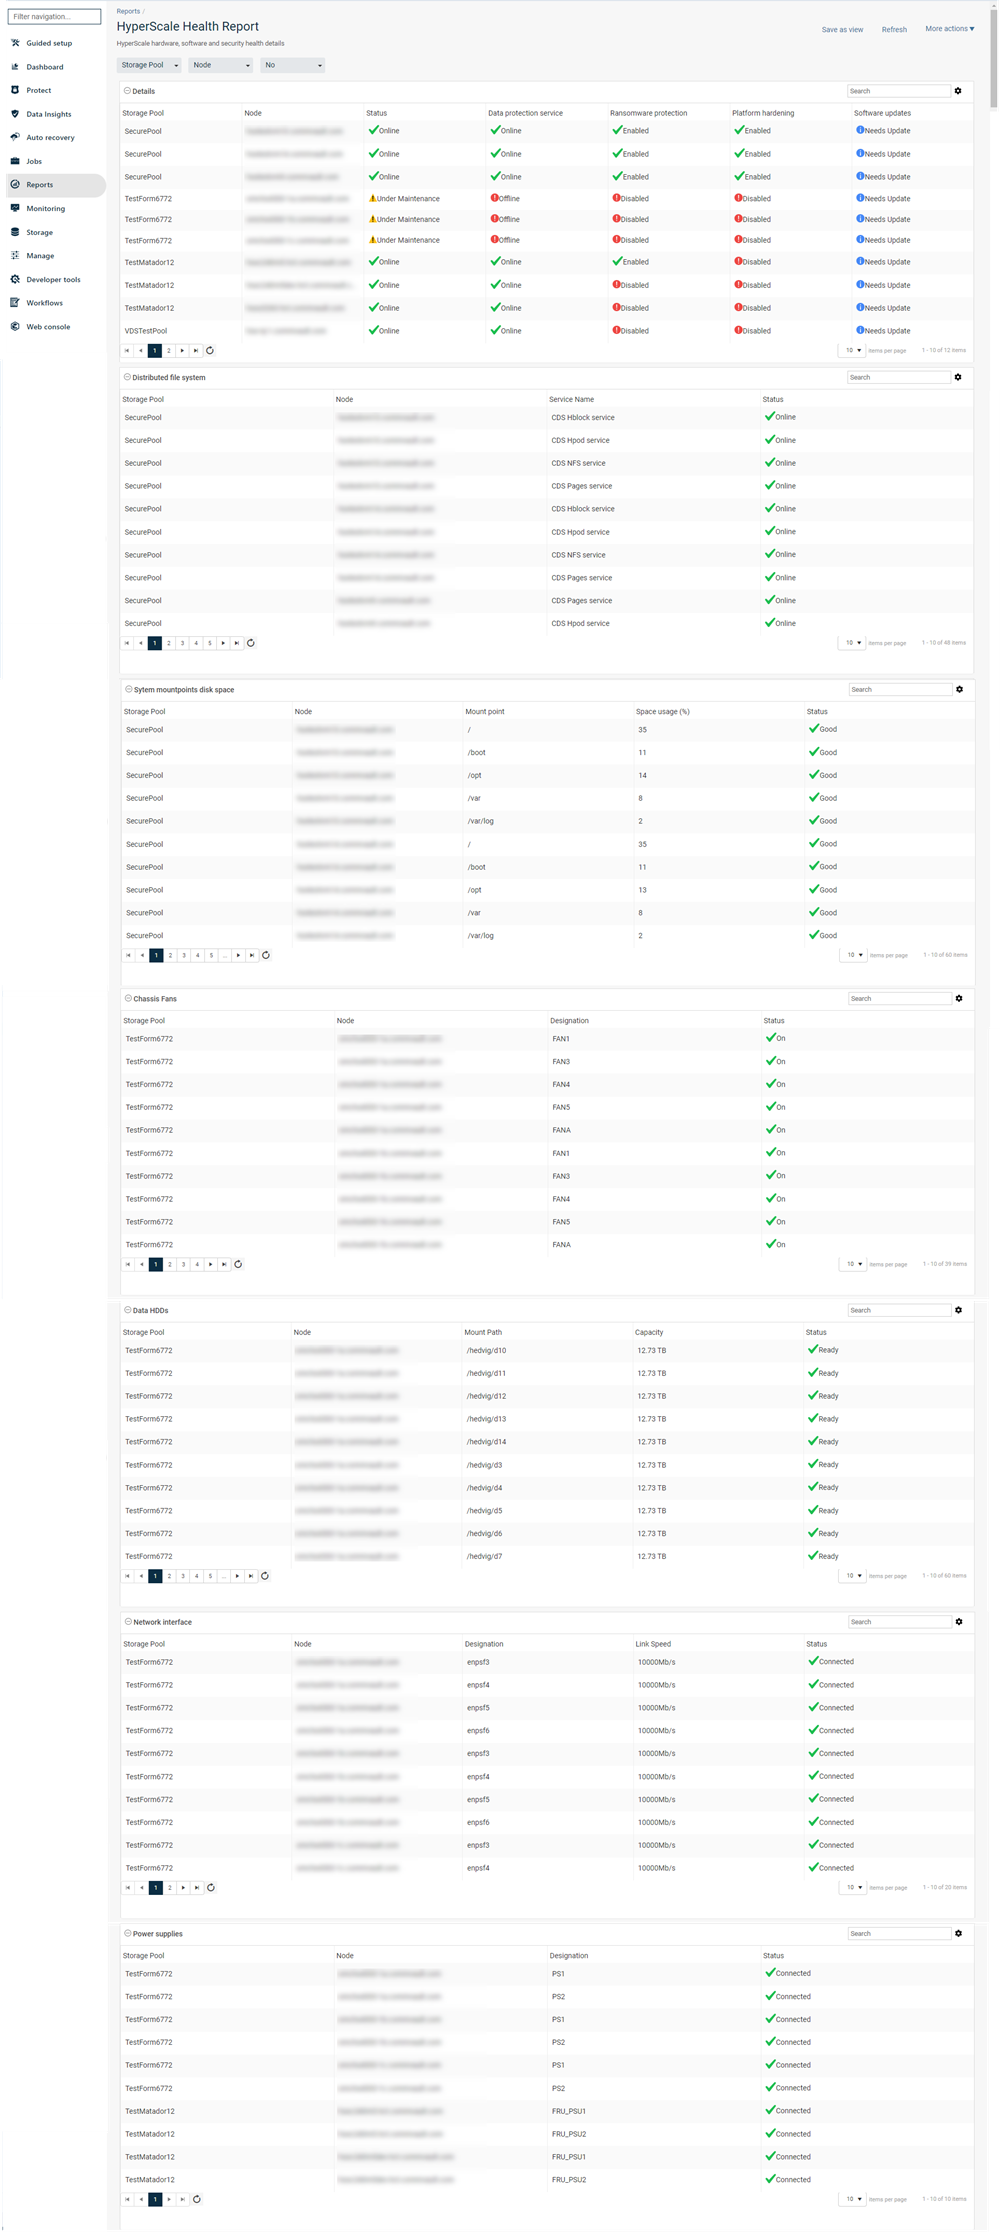
HyperScale Health Report
You can view a detailed HyperScale Health Report for a HyperScale storage pool from the Reports tab.
The report provides detailed sub-sections for each hardware component, including disks, cooling devices, power supplies, and network interfaces.
You can also filter the report data based on the storage pool and the node associated with the selected storage pool.
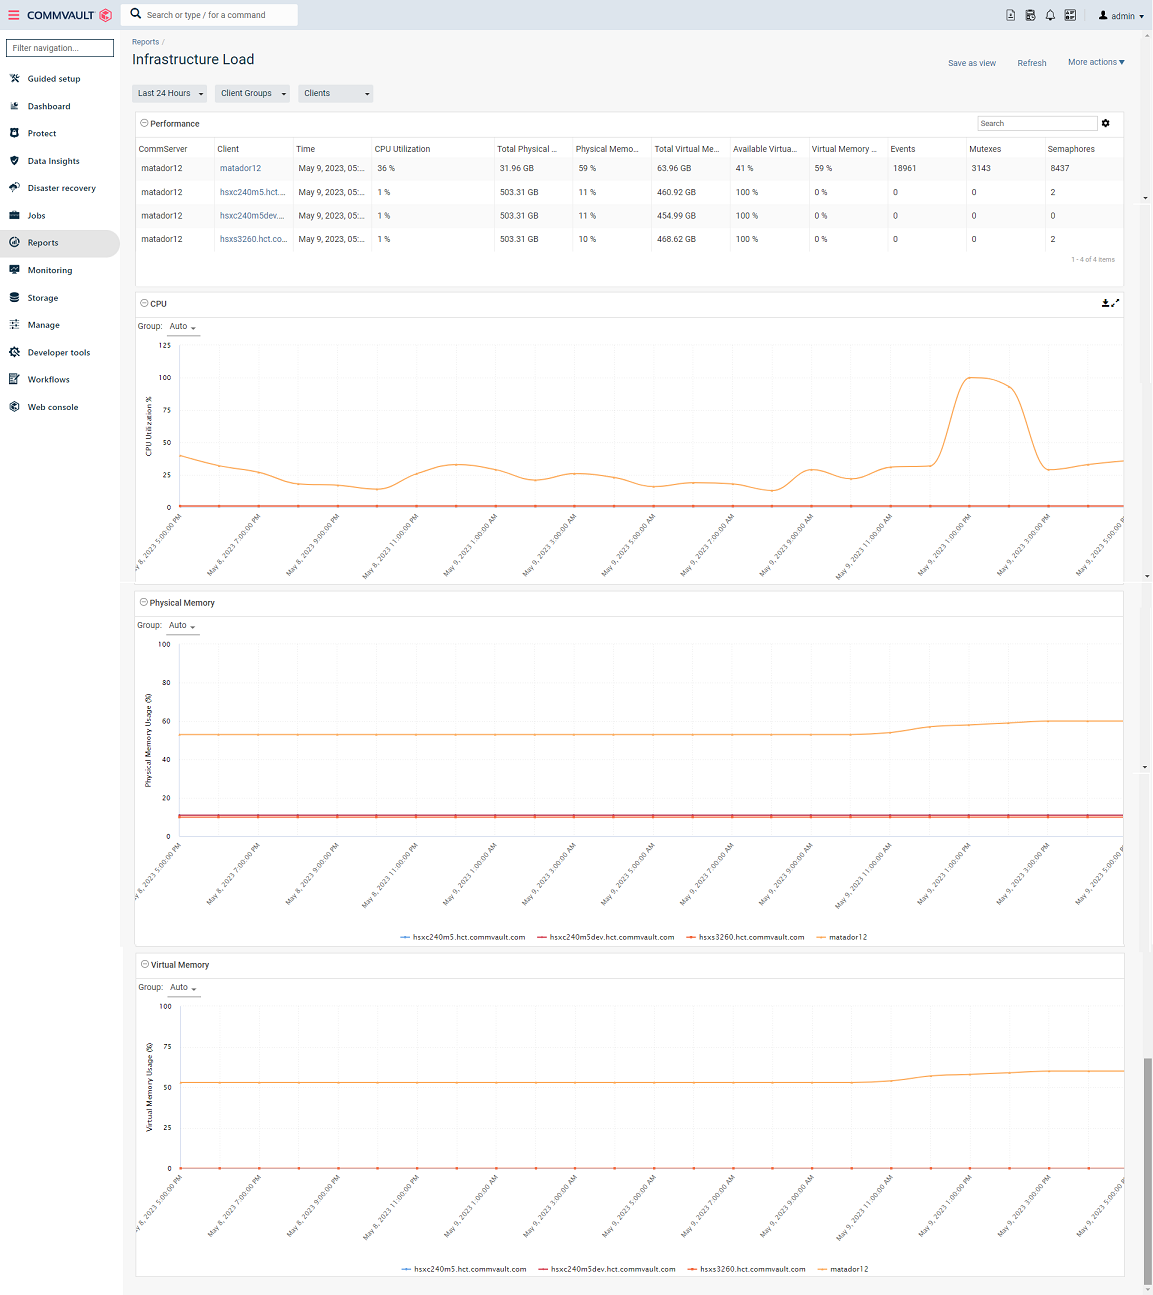
Infrastructure Load Report
The Infrastructure Load report displays performance-related metrics for each node. It includes charts that show CPU utilization, physical memory usage, and virtual memory usage.