The License Peak Usage Report displays peak usage for each license type over time. To view more details about usage for a specific license, click on the bar for a month.
Backup peak usage per month
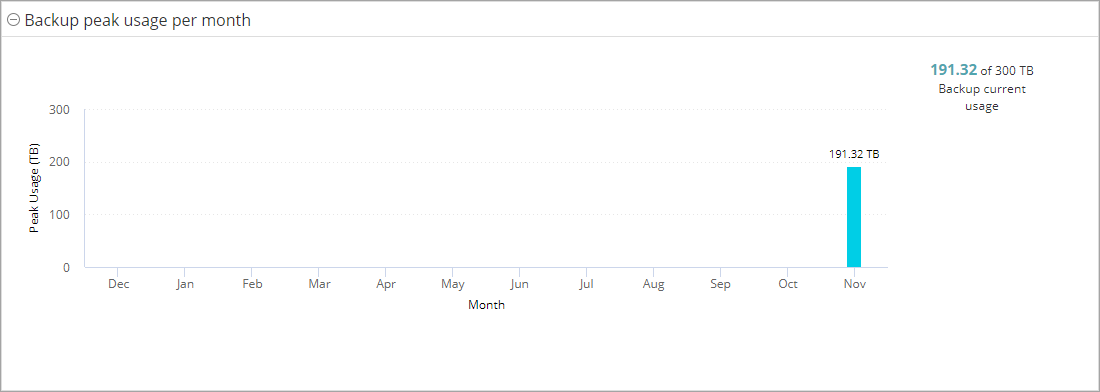
The Backup peak usage per month chart displays the largest amount of data that was protected by the Backup Capacity license during each of the previous 12 months. The chart also indicates the amount of Backup Capacity that is used from the amount of Backup Capacity that is purchased.
To view the License Peak Usage Report for Backups, click a bar.
Snapshot peak usage per month
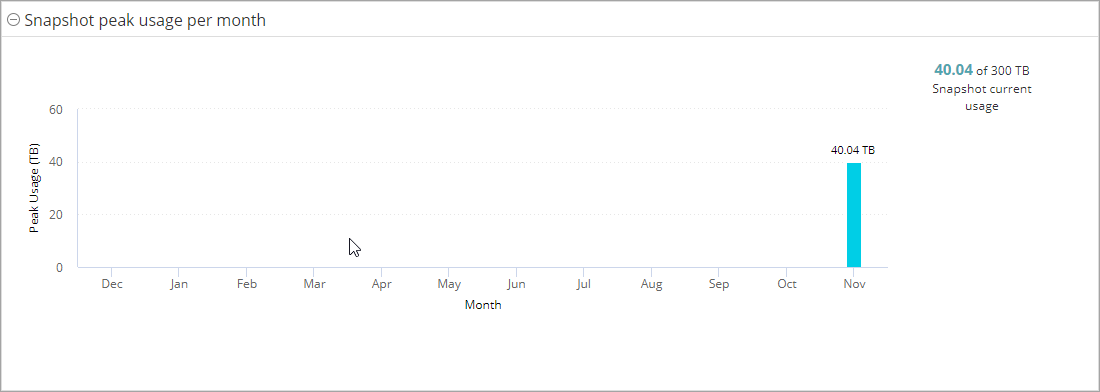
The Snapshot peak usage per month chart displays the largest amount of data that was protected by the Snapshot Capacity license during each of the previous 12 months.
To view the License Peak Usage Report for Snapshots, click a bar.
Replication peak usage per month
The Replication peak usage per month chart displays the largest amount of data that was protected by the Replication Capacity license during each of the previous 12 months.
To view the License Peak Usage Report for Replication, click a bar.
Archive peak usage per month
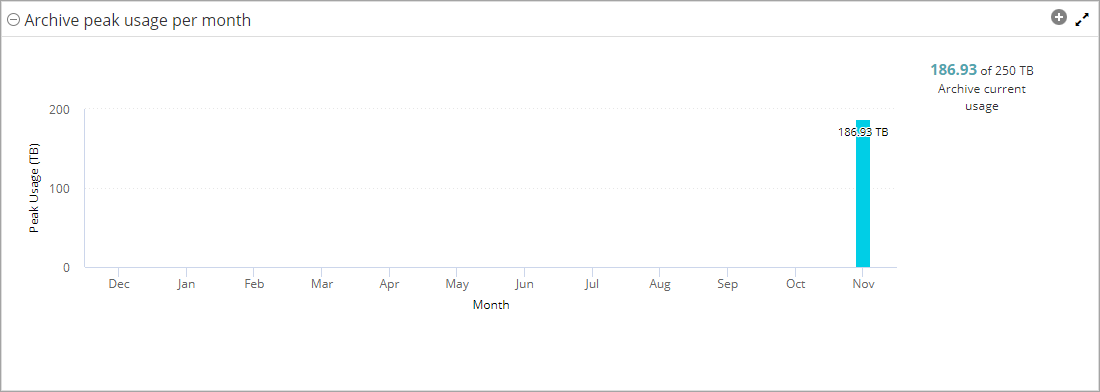
The Archive peak usage per month chart displays the largest amount of data that was protected by the Archive Capacity license during each of the previous 12 months. The chart also indicates the amount of Archive Capacity that is used from the amount of Archive Capacity that is purchased.
To view the License Peak Usage Report for Archive Jobs, click a bar.
VM Sockets peak usage per month
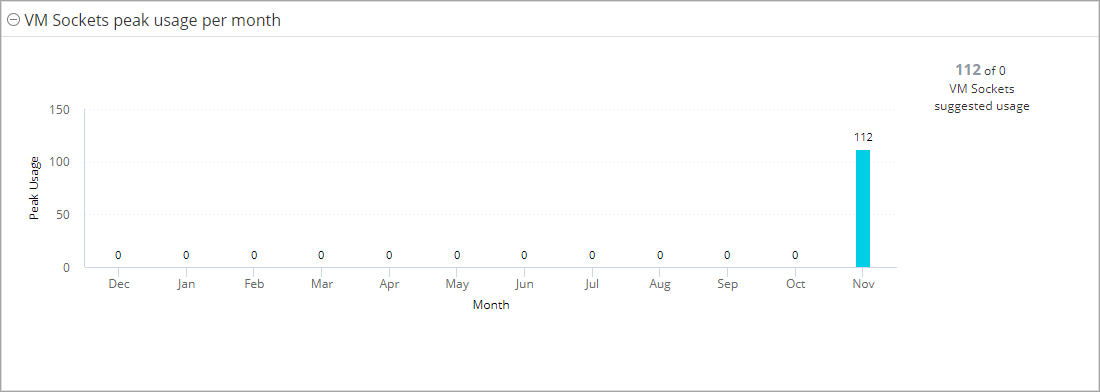
The VM Sockets peak usage per month chart displays the highest number of VM sockets that were protected by the VM Sockets license during each of the previous 12 months.
To view the License Peak Usage Report for VM Sockets, click a bar.
Protected VMs peak usage per month
The Protected VMs peak usage per month chart displays the largest backup jobs for client computers and/or VMs configured with the Virtual Server agent for all supported hypervisor types during each of the previous 12 months.
To view the License Peak Usage Report for Protected VMs, click a bar.
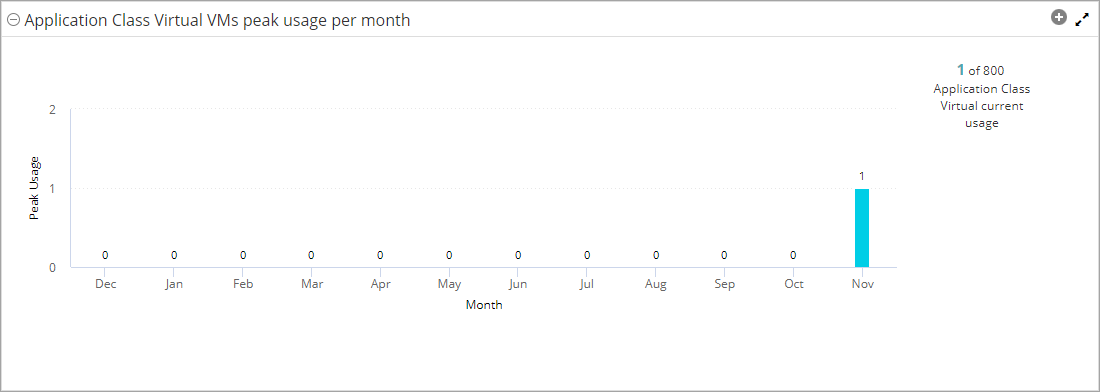
Application Class Virtual VMs peak usage per month
The Application Class Virtual VMs peak usage per month chart displays the highest number of VMs that were protected by the Application Class Virtual license during each of the previous 12 months.
To view the License Peak Usage Report for Application Class Virtual VMs, click a bar.
Archived VMs peak usage per month
The Archived VMs peak usage per month chart displays the highest number of VMs that were protected by the Archived VMs license during each of the previous 12 months.
To view the License Peak Usage Report for Archived VMs, click a bar.
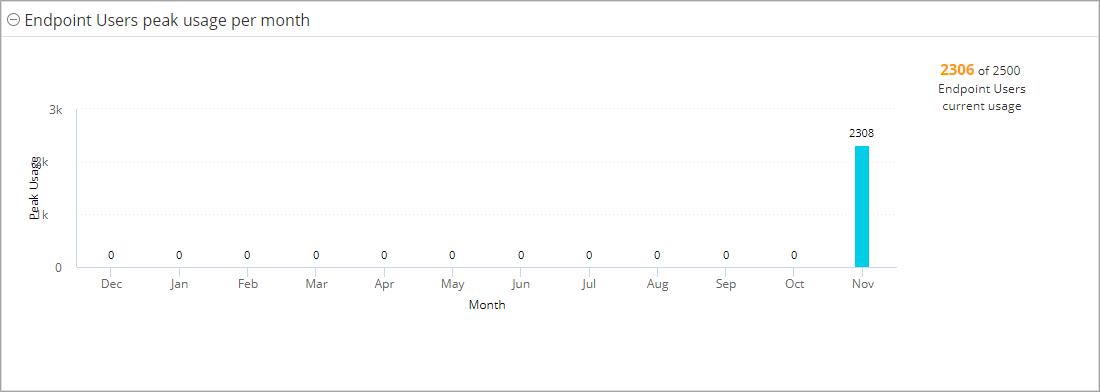
Endpoint Users peak usage per month
The Endpoint Users peak usage per month chart displays the highest number of Endpoint users that consumed the Endpoint Users license during each of the previous 12 months.
To view the License Peak Usage Report for Endpoint Users, click a bar.
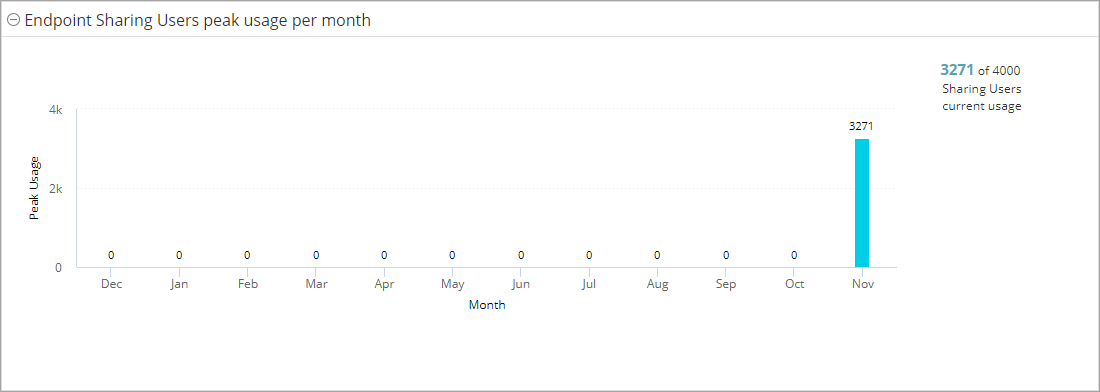
Endpoint Sharing Users peak usage per month
The Endpoint Sharing Users peak usage per month chart displays the highest number of Endpoint Sharing users that consumed the Endpoint Sharing Users license during each of the previous 12 months.
To view the License Peak Usage Report for Endpoint Sharing Users, click a bar.
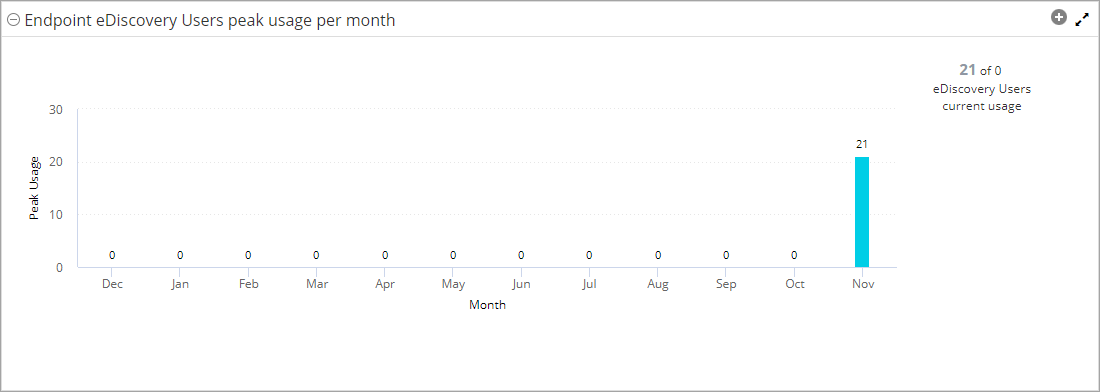
Endpoint eDiscovery Users peak usage per month
The Endpoint eDiscovery Users peak usage per month chart displays the highest number of Endpoint eDiscovery users that consumed the Endpoint eDiscovery Users license during each of the previous 12 months.
To view the License Peak Usage Report for Endpoint eDiscovery Users, click a bar.
Application Users peak usage per month
The Application Users peak usage per month chart displays the highest number of Application users that consumed the Application Users license during each of the previous 12 months.
To view the License Peak Usage Report for Application Users, click a bar.

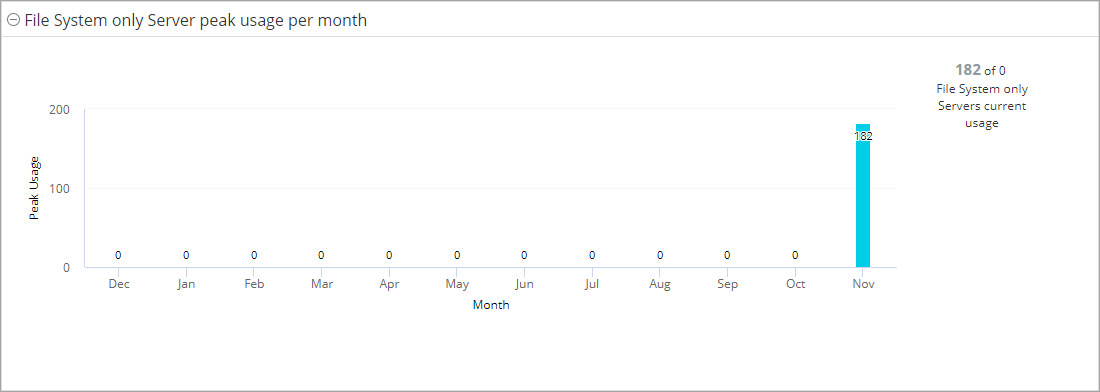
File System only Server peak usage per month
The File System only Server peak usage per month chart displays the highest number of file-system-only servers that consumed the File System only Server license during each of the previous 12 months.
To view the License Peak Usage Report for File System only Servers, click a bar.
Desktop and Laptop only peak usage per month
The Desktop and Laptop only peak usage per month chart displays the highest number of desktops and laptops that consumed the Desktop and Laptop only license during each of the previous 12 months.
To view the License Peak Usage Report for Desktops and Laptops only, click a bar.

Application Server peak usage per month
The Application Server peak usage per month chart displays the highest number of servers that consumed the Application Server license during each of the previous 12 months.
To view the License Peak Usage Report for Application Servers, click a bar.

VM only peak usage per month
The VM only peak usage per month chart displays the highest number of VMs that consumed the VM only license during each of the previous 12 months.
To view the License Peak Usage Report for VMs only, click a bar.
Advanced VM peak usage per month
The Advanced VM peak usage per month chart displays the highest number of VMs that consumed the Advanced VM license during each of the previous 12 months.
To view the License Peak Usage Report for Advanced VMs, click a bar.